In this final edition of introducing wins above replacement (WAR) to the dynasty fantasy world, we apply the lessons from Part 2 to supply established teams past their inaugural draft strategies to capitalize on leveraging WAR to add more wins to their team’s 2020 record book. For a refresher on the theory of WAR and how dynasty owners can use it for inaugural drafts, check it out here:
Before learning the theory of WAR, you might have recoiled at the thought of the trade ideas I’m going to recommend. Therein lies the real beauty of looking through the lenses of WAR. Not only does the math work out that such proposals will be worth it – but the reluctance you might feel in offering will make finding a willing trade partner that much easier.
Theory into Action
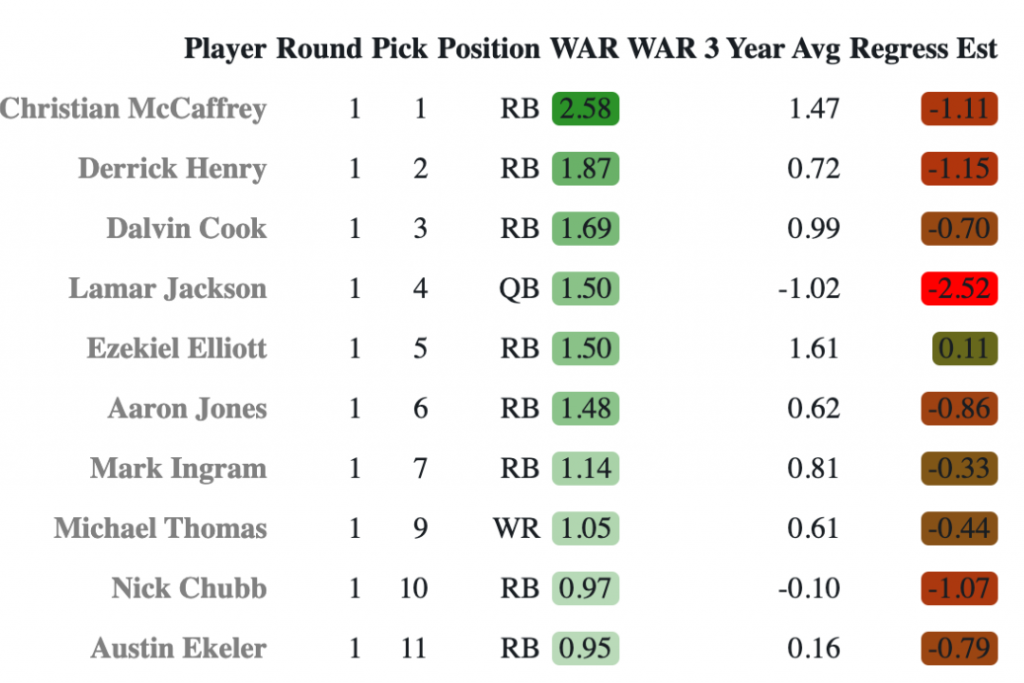
Let’s get things started. Below is a table of the 2019 WAR results for .5 PPR in order of which selection (round and pick) every player ended up being worthy of drafted. You’ll notice WAR is provided with a shade of green to give a pseudo-tier representation. The final column “Regression Est” is how much regression we might expect in 2020 based on taking the average WAR for the past three years of each player and subtracting their 2019 WAR from it. The greener the shade, the more the model suggests this could be a buy-low candidate; the more red suggests that player might be a good sell-high. While it’s admittedly a blunt tool, if used correctly, it can be a useful starting point in seeking out players to take on and ship off.
Note: NA is placed in the “Regress Est” column for anyone with only one year in the books (ex: Josh Jacobs) as there is no prior year data to regress from.
Here are the results for the top-36 performers of 2019 in order of the positional WAR average (per game basis) for each position across 2015-2019 (as explained in Part-2):
| Player | Round | Pick | Position | WAR | WAR 3 Year Avg | Regress Est |
|---|---|---|---|---|---|---|
| Christian McCaffrey | 1 | 1 | RB | 2.58 | 1.47 | -1.11 |
| Derrick Henry | 1 | 2 | RB | 1.87 | 0.72 | -1.15 |
| Dalvin Cook | 1 | 3 | RB | 1.69 | 0.99 | -0.70 |
| Lamar Jackson | 1 | 4 | QB | 1.50 | -1.02 | -2.52 |
| Ezekiel Elliott | 1 | 5 | RB | 1.50 | 1.61 | 0.11 |
| Aaron Jones | 1 | 6 | RB | 1.48 | 0.62 | -0.86 |
| Mark Ingram | 1 | 7 | RB | 1.14 | 0.81 | -0.33 |
| Michael Thomas | 1 | 9 | WR | 1.05 | 0.61 | -0.44 |
| Nick Chubb | 1 | 10 | RB | 0.97 | -0.10 | -1.07 |
| Austin Ekeler | 1 | 11 | RB | 0.95 | 0.16 | -0.79 |
| Travis Kelce | 1 | 12 | TE | 0.91 | 1.05 | 0.14 |
| George Kittle | 2 | 1 | TE | 0.91 | 0.57 | -0.34 |
| Chris Godwin | 2 | 2 | WR | 0.91 | -0.04 | -0.95 |
| Josh Jacobs | 2 | 3 | RB | 0.90 | NA | NA |
| Mike Evans | 2 | 4 | WR | 0.89 | 0.56 | -0.33 |
| Chris Carson | 2 | 5 | RB | 0.88 | 0.29 | -0.59 |
| Dak Prescott | 2 | 6 | QB | 0.85 | 0.32 | -0.53 |
| Todd Gurley | 2 | 7 | RB | 0.80 | 1.94 | 1.14 |
| Austin Hooper | 2 | 8 | TE | 0.73 | 0.20 | -0.53 |
| Leonard Fournette | 2 | 9 | RB | 0.70 | 0.90 | 0.20 |
| Russell Wilson | 2 | 10 | QB | 0.67 | 0.67 | 0.00 |
| Marlon Mack | 2 | 11 | RB | 0.66 | 0.35 | -0.31 |
| Alvin Kamara | 2 | 12 | RB | 0.65 | 1.25 | 0.60 |
| Joe Mixon | 3 | 1 | RB | 0.64 | 0.54 | -0.10 |
| Mark Andrews | 3 | 3 | TE | 0.61 | -0.23 | -0.84 |
| Deshaun Watson | 3 | 4 | QB | 0.61 | 0.93 | 0.32 |
| Tyreek Hill | 3 | 5 | WR | 0.60 | 0.77 | 0.17 |
| Melvin Gordon | 3 | 6 | RB | 0.59 | 1.25 | 0.66 |
| Darren Waller | 3 | 7 | TE | 0.56 | NA | NA |
| Julio Jones | 3 | 8 | WR | 0.56 | 0.56 | 0.00 |
| DeVante Parker | 3 | 9 | WR | 0.55 | -0.32 | -0.87 |
| Kenyan Drake | 3 | 10 | RB | 0.53 | 0.13 | -0.40 |
| Zach Ertz | 3 | 11 | TE | 0.52 | 0.64 | 0.12 |
| Kenny Golladay | 3 | 12 | WR | 0.52 | 0.01 | -0.51 |
Let’s focus on just the strict WAR rankings column with the green gradient coloring first. Would you have guessed Dalvin Cook was more valuable in 2019 (as defined by providing your fantasy team more wins) than Michael Thomas in .5 PPR? I’m guessing not. I polled my Twitter followers who they’d value between Thomas and even higher regarded RB (Ezekiel Elliott), and the results were pretty one-sided:
Dynasty polls for an upcoming article. Help me out.
— Stathole Sports (@Statholesports) April 2, 2020
Pick who you’d rather have to start a dynasty team with.
(.5 PPR)@DynastyNerds #nerdherd #FantasyFootball
The Comps
What about Tyreek Hill vs Alvin Kamara?
Start Dynasty league. .5 PPR. Pick one.
— Stathole Sports (@Statholesports) April 2, 2020
Was Nick Chubb a better value on a per-game basis over Chris Godwin? I’m guessing you’re brain is not comprehending this. But given the high replace-ability of the WR position, this is true. The trend I’m trying to show here is that the dynasty community favors the longevity of WR vs. short-lived RBs despite the minimal WAR impact WR provides and a high degree of replace-ability. But as I argued in Part 2 of this series, the average age of top-performing RBs in 2020 is ridiculously young. You can be just about as confident that these RBs will be there for you two or three years down the road. Take the gains in WAR from this invaluable position and put yourself in the mix to win some rings by taking a hard look at the top WRs on your roster and trading for an RB.
The Focus
Let’s focus on the colorful right-most “Regress Est” column now. The model reveals which players might be worth trading away (red) vs. trading for (green). Of course, it doesn’t know a lick about context. For instance, the bright red -2.52 regression estimate for Lamar Jackson would suggest a substantial downward regression because it took into account his modest performance in sparse time in 2018 before having an entire offense designed around him in 2019. The same idea can be applied inversely. Todd Gurley’s bright green “buy-low” indicator has no idea that unlike in 2017 and 2018, Gurley now has a severe and chronic injury issue and – oh by the way – is on a completely different team now. But for most players with some level of consistency in their current and past situations, the regression estimate could be a helpful tool to scope out trade ideas. Evaluate the figure on a case-by-case basis accordingly.
Scrolling down this right-most “Regression Est” column, the first few names I see as legit buy-low options include Leonard Fournette, Alvin Kamara, and Zach Ertz. I’ve discussed in Part 2 the value you can get out of a top-TE, so for the right price, win-now mode teams could capitalize on a thoroughbred TE. On the other hand, sell-highs include the top of the WR position – Thomas and Godwin. For example, I’d send Thomas off for Elliott and a replacement-level WR in a heartbeat – and judging by the poll above, you won’t have any issue pulling such a trade-off. There’s a multitude of options, so use the chart and find one that fits your team best.
A Deeper Look
Here’s a deeper look with the next top-36 WAR performers of 2019:
| Player | Round | Pick | Position | WAR | WAR 3 Year Avg | Regress Est |
|---|---|---|---|---|---|---|
| Hunter Henry | 4 | 1 | TE | 0.51 | NA | NA |
| Jordan Howard | 4 | 2 | RB | 0.50 | 0.42 | -0.08 |
| James Conner | 4 | 3 | RB | 0.50 | 0.23 | -0.27 |
| Saquon Barkley | 4 | 4 | RB | 0.48 | 0.17 | -0.31 |
| Michael Gallup | 4 | 5 | WR | 0.47 | NA | NA |
| Calvin Ridley | 4 | 6 | WR | 0.46 | NA | NA |
| Amari Cooper | 4 | 7 | WR | 0.46 | 0.21 | -0.25 |
| Cooper Kupp | 4 | 8 | WR | 0.43 | 0.26 | -0.17 |
| Jameis Winston | 4 | 9 | QB | 0.43 | 0.13 | -0.30 |
| DeAndre Hopkins | 4 | 10 | WR | 0.43 | 0.82 | 0.39 |
| A.J. Brown | 4 | 11 | WR | 0.42 | NA | NA |
| Davante Adams | 5 | 1 | WR | 0.40 | 0.64 | 0.24 |
| Ryan Tannehill | 5 | 3 | QB | 0.39 | NA | NA |
| Jared Cook | 5 | 4 | TE | 0.39 | 0.21 | -0.18 |
| Miles Sanders | 5 | 5 | RB | 0.37 | NA | NA |
| Matthew Stafford | 5 | 7 | QB | 0.36 | -0.10 | -0.46 |
| Adam Thielen | 5 | 9 | WR | 0.33 | 0.36 | 0.03 |
| Phillip Lindsay | 5 | 10 | RB | 0.30 | NA | NA |
| Damien Williams | 5 | 11 | RB | 0.28 | -0.40 | -0.68 |
| Golden Tate | 5 | 12 | WR | 0.28 | -0.05 | -0.33 |
| D.J. Moore | 6 | 1 | WR | 0.27 | NA | NA |
| Tyler Lockett | 6 | 3 | WR | 0.26 | -0.07 | -0.33 |
| Devin Singletary | 6 | 4 | RB | 0.25 | NA | NA |
| D.J. Chark | 6 | 5 | WR | 0.25 | NA | NA |
| Devonta Freeman | 6 | 6 | RB | 0.24 | 0.01 | -0.23 |
| Tyler Higbee | 6 | 7 | TE | 0.24 | -0.28 | -0.52 |
| Marvin Jones | 6 | 9 | WR | 0.22 | 0.17 | -0.05 |
| Alshon Jeffery | 6 | 10 | WR | 0.21 | 0.13 | -0.08 |
| Kaden Smith | 6 | 11 | TE | 0.21 | NA | NA |
| Allen Robinson | 6 | 12 | WR | 0.20 | -0.51 | -0.71 |
To Conclude
To wrap up this series: in Part 1, I explained the methodology of the theory to prove its ability to compare the performance of cross-positional players precisely. Then in Part 2, we extrapolated the impact of WAR at the position-level and graphed the hierarchy of impact each position has along with the degree of separation from one another. Finally, in Part 3, we used all of this to chart the top-performers in 2019 and compared each player’s performance against their past three years as a loose tool for predicting regression one way or the other. We discussed the dynasty consensuses affinity for WRs and proposed a contrarian view heavily in favor or RBs and discussed some non-exclusive trade ideas while leaving the charts free for you to explore further on your own.
Father of economics Adam Smith once said “every man lives by exchanging”. Don’t be the person in your fantasy league who refuses to live. Use WAR to not only live in your league, but thrive.

