Prior to the start of the 2019 fantasy football season, I developed a new way of evaluating fantasy football players by charting their estimated wins above replacement provided over the course of the fantasy regular season. The beauty of this metric is that it allows for the comparison in production between cross-positional players and reveals exactly what draft selection each player ended up being worth.
Comparing cross-positional players has been historically a subjective enterprise. There are other similar metrics out there – namely VDB – but WAR is able to consider week-to-week consistency into the model. This helps you figure out to what extent a boom/bust player is worth.
In this three-part series, we are going to take a deep dive into WAR. Here is how it’s going to go:
Part 1 – The Theory: an explanation for how this metric was created and its underlying logic
Part 2 – The Practice: Putting WAR to use on a broader scale; why it should be your starting point of research for your inaugural dynasty draft
Part 3 – The Oil: a framework for self-scouting your team weaknesses and analytically comparing cross-positional players trade proposals to address such weaknesses
Part 1 – The Theory
For calculation purposes, league settings matter. I’m using half-point PPR as a middle ground with a starting roster of QB, RB, RB, WR, WR, Flex, TE, DST, and K in a 12-team league. Don’t worry too much if you play in a standard or full PPR format – the results will be similar and I’ll point out the subtle differences along the way. For leagues that differ starkly in roster type (2QB, super-flex, three-WR etc.) a customized WAR calculation with such settings is necessary, but outside the scope of this introductory series. I hope to explore calculating WAR for more settings in the future, but for now, we’ll stick with the basics.
With that said, the first calculation we need to make is to estimate what the average team scores in a week under the above-determined settings. Assume the top 12 QB, TE, DST, and K are rostered and started each week as well as the top-24 RBs and WRs. If we take all weekly outputs for these top ranks and obtain the average and standard deviation of each separate position, we can build a theoretical probability distribution for the average fantasy team’s weekly output. Simply add all individual positions together (flex is a little more work but easily doable) to obtain the average weekly team points scored. We also need to standard deviation of each. Here is what this looks like for each position:
This provides what we need to map the average half-point PPR fantasy team’s weekly score probability distribution for 2019:
Average Points Per Week: 116.92
Standard deviation of Points Per Week: 21.66
For curiosity sake, standard league average was about 103 (PPR 131) with similar standard deviations.
With an average team probability distribution estimation created, we now have a basis for evaluating the effect of an individual player. This part will be much easier to explain with an example.
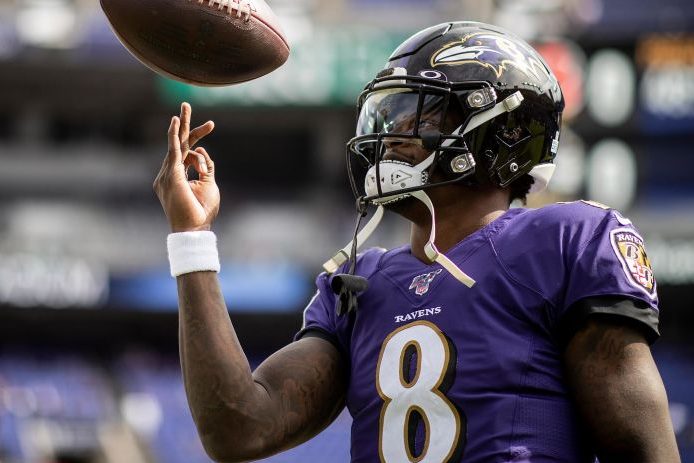
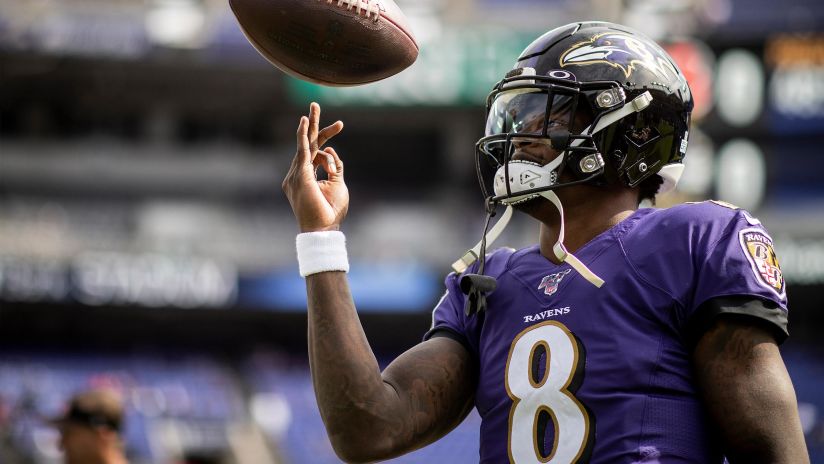
Let’s calculate WAR for 2019 fantasy standout Lamar Jackson. The average QB in a 12-team league scored about 21 points per week. Let’s say you started Lamar Jackson in the second round of the fantasy playoffs in Week 15; this resulted in a 37-point start to your weekend. Jackson gave you an estimated 16 points above the 21-point fantasy league average so we just need to add 16 to the average fantasy team score of 116.92 to get the owner’s expected team score after starting Jackson: 132.92.
We now need to determine the odds that 132.92 is going to beat an average opponent’s expected 116.92. Notice that we assume our opponent’s entire team will produce the average amount of points. We also assume this for the rest of our starting roster. This puts the focus solely on the player we are interested in evaluating. And because we know the standard deviation of our opponent (21.66), we can calculate the percent chance that the average fantasy team scores less than our team’s estimated 132.92 points. For Lamar Jackson owners in Week 15, that turned out to be 77.3 percent. Simply put, Lamar Jackson gave his fantasy team owners a 77.3 percent chance of winning Week 15 without knowing any other information about either team.
To obtain Lamar Jackson’s WAR, we repeat the above process for each week he played and average all percentages together to obtain his seasonal average. This turned out to be 63.4 percent meaning – all other things being equal – you could expect to win 63.4 percent of your head to head match-ups in 2019 solely due to starting Lamar Jackson. Here is a look at each weekly win percentage he provided fantasy owners in 2019:
The next part of the process is figuring Jackson’s seasonal win values. This is done simply by multiplying his 63 percent average obtained above and multiplying it by 12 (games in a fantasy regular season minus player bye).
.634 * 12 = 7.6 seasonal win value (games won due to Jackson)
This leaves us with the number of games we expect Lamar Jackson owners to have won in 2019 without considering any other player on their team or their opponent: 7.6 games.
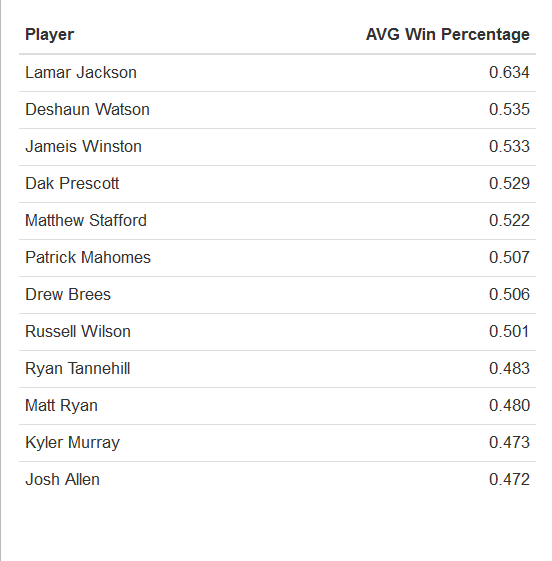
But wait, we’re not done yet. We need to compare this 7.6 games won to how many games a replacement-level QB would be expected to win. The same process of averaging each weekly win percentage for all quarterbacks is performed just as done with Lamar Jackson. Below are the results for the top-12 revealing Josh Allen to be 2019’s replacement-level for quarterback win a 47.2 fantasy team weekly win percentage:
Multiply this percentage as done with Jackson’s and you can expect to win 5.65 fantasy wins per year with the 12th best fantasy quarterback: Josh Allen. Finally, subtract this 5.65 games from Jackson’s 7.6 and presto! We are returned with Lamar Jackson’s official wins above replacement for 2019: 1.95 games.
This entire process is repeated for all positions with a couple of exceptions:
For DST’s and kickers, given the high week-to-week turnover in fantasy due to streaming, I combined each week’s 12th best performance (as opposed to season) and averaged this all together to obtain the replacement-level average win percentage. This effectively raised the expected wins for a replacement-level player and in turn reduces the WAR of the top performers.
The flex position needed to be dealt with too. To get the average and replacement-level flex scores, I removed the top 24 WRs, RBs and the top 12 TEs of the season from consideration assuming all of these players would occupy league roster spots in their respective native positions. From there, the top 12 (WR/RB/TE) left in the running were analyzed as one position: flex.
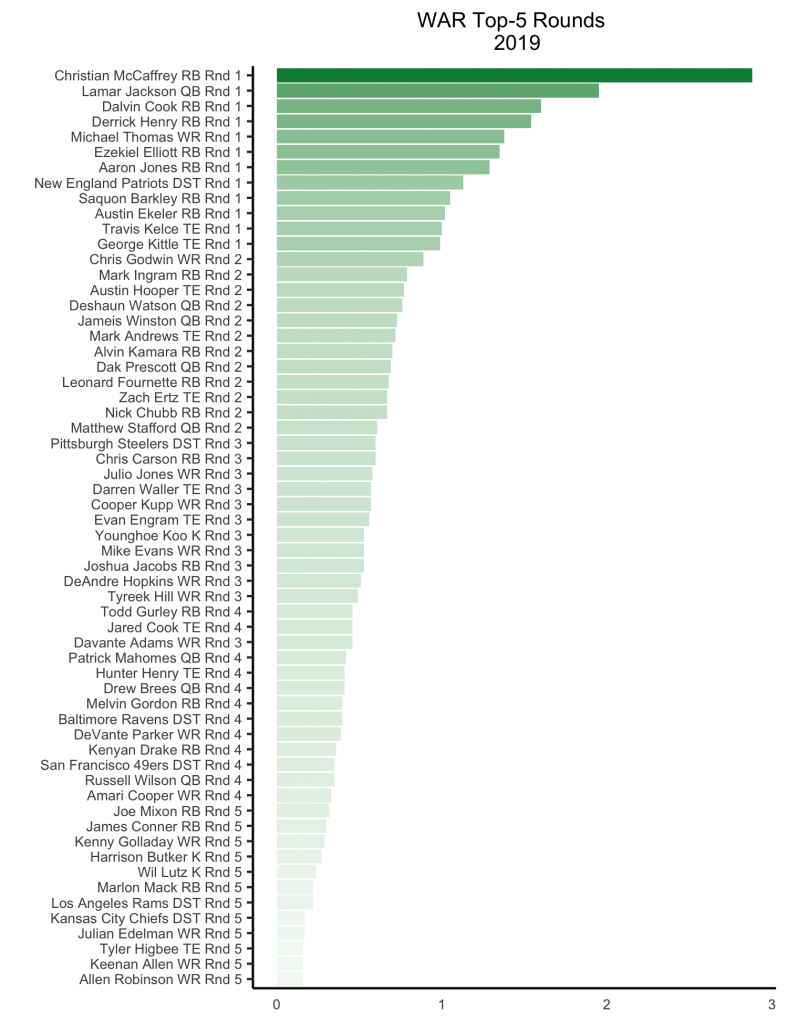
With all the analytical work behind us, now we can chart out the top performing fantasy players of 2019. Part of the fun of this is ordering all fantasy players by WAR and using this as a determination of what each player was worth drafting after the fact. Here are how the first five rounds would have optimally looked through the magic of hindsight in order of each selection from top to bottom:
Some things to keep in mind: WAR isn’t a predictive measure. Any surprise names (or positions) you see in the top-5 rounds aren’t necessarily expected to perform as such in 2020. This is especially the case with DSTs and kickers. Variance is so high among these positions year-over-year that projecting similar outputs going forward is a fool’s errand.
While WAR doesn’t predict what to expect out of any individual player the following year, positions might be a different story. In Part 2 of this series, we’ll address this by producing a quantitative hierarchy of fantasy football position importance. Doing so will reveal which positions have better replacement-player values or top-tier studs you should prioritize in your inaugural dynasty fantasy football draft.

