Speed kills. Earlier this offseason, we witnessed one of the fastest NFL Combines ever. The scary thing is that each class is just going to continue to get bigger, stronger, and faster. Today, I hope to provide you with information as I analyze the growth of incoming freshmen to when they participate in the NFL Combine.
For this exercise, I compare high school metrics courtesy of @247Sports and NFL Combine data courtesy of Pro Football Reference. I sourced high school track records for the NFL players that participated in the NFL Combine 40-yard dash. Then I compare their high school time compared to their 40-time and if this was a predictive input in the future.
PROGRESSION
It is predictive! First, let’s talk about the progression a freshman’s body takes between stepping on campus and becoming an NFL prospect three years removed from graduating high school. The average prospect is listed 0.7 inches shorter than their official NFL Combine height and gains 16.7 lbs.
This all makes sense. It is a good indicator the data represents an assumption we may have made- players can get faster and stronger through their strength and conditioning programs. However, I want to emphasize speed. The 40-yard dash is the featured event during the NFL Combine weekend and can drastically impact a player’s draft capital.
One is either born with more “fast-twitch” muscles, or you are born with more “slow-twitch” muscles. People who have increased levels of fast-twitch muscles are more suited to short-distance sprinting. This creates a chicken or egg dichotomy in this situation. Is a player fast because they ran track, or does a player run track because they’re fast?
Nevertheless, what we know to be true is that a player who runs track, specifically the 100-meter sprints, has been coached up on the proper technique and form on how to run a successful sprint. This bears out to be true, overall players who ran track among running backs and wide receivers. See the below graphic for comparison.

HISTORICAL MEASURABLES
The sample size of players that I analyzed includes players who both have a verified 100-meter-sprint time in their high school records and ran the 40-yard-dash at the NFL Combine. There have been 131 running backs drafted since 2014, and 70 (53%) have corresponding 100-meter-dash times. Additionally, of the 206 wide receivers drafted in that same timespan and 68 (33%) have verified sprinting times.
The predictive 40-yard dash for running backs with a 100-meter-dash can be used with the following equation. Start with 0.0669 x (100-meter-dash) + 3.7568. This formula has an r-squared value of 0.228, which is not strong but is expected when working with smaller sample datasets. The below chart shows the expected 40-yard dash time based on each half of a second bin for a high school 100-meter sprint.

The below chart shows exactly what you might expect from this data set. There is a strong relationship between high school times and 40-yard dash times. Variance is expected in this dataset as we compare players with up to eight years difference. A player could have hit their record as a freshman in high school before adding mass, then run at the combine after four years in college.

Now that the 2022 NFL Combine has concluded and most official times have been reported, how does this data compare to their predicted times? The graphic below conveys how powerful this is. It confirms that many outliers are players who increased their speed from high school on their journey to the NFL. Ty Chandler, a former Tennessee and North Carolina back, had shown the most improvement of this bunch.

It also looks like players like Kennedy Brooks and Tyler Allgeier added mass to their frames and were not able to retain their speed. We expect this to be much more prevalent among running backs than it should be with wide receivers based on the physical pounding that their bodies take at the position. Let’s transition to the wide receivers to see if their data is as sticky as it is for the running backs.
Wide receivers have even stickier data, as the positional skillset much more closely compares to the traits of Olympic sprinters. The following equation can use the predictive 40-yard dash for wide receivers with a 100-meter-dash. Start with 0.0898 x (100-meter-dash) + 3.4438. This formula has an r-squared value of 0.205, which is like the stickiness of running backs. The below chart shows the expected 40-yard dash time based on each half of a second bin for a high school 100-meter sprint.
Note: while the r-squared is higher for running backs than it is for wide receivers, the “stickiness” of the data lies in the p-value. Wide receivers have a lower p-value indicating there is less noise and more signal to be found.

Among players who broke the 10.5-second threshold, the worst 40-time has been a 4.43-second 40-yard-dash, which is one key number to look out for when scouting NFL prospects at any level. We can see how these two numbers are tied together as the average 40-yard-dash time gradually moves with the 100-meter-sprint time.

The 2022 NFL Combine has concluded, and official times have been reported. How does this data compare to their predicted times? The graphic below conveys how powerful this is and confirms that many of the outliers are players who increased their speed from high school on their journey to the NFL.

Here is an observation of a time when double-counting is allowed. Many say do not double count 40-times. Garrett Wilson out of Ohio State was projected to run in the 4.5-second range. He toasted that with an official 4.38-second 40-time. It is okay to count his newfound speed into your models now that he has exceeded expectations.
THE FASTEST COLLEGE FOOTBALL PLAYERS
Fifteen players project to run sub-4.4-second 40-times. These are all receivers who posted a 10.61-second 100-meter-sprint in high school. This list includes players that won’t be NFL Draft eligible until 2023 to 2026. With a presumed 17 lbs. weight gain with their college program, we can also predict a player’s speed score. The calculation for Speed Score is simple and contains only two inputs, 40-yard dash time and weight; the full formula is Speed Score = (Weight/200)/(40-time^4).

As we can see, the future of the WR certainly won’t be lacking in speed. There are some projected size-speed freaks on this list. That list includes injured true freshman Adam Randall and the pure speedster from Georgia, Arian Smith. These predictive metrics, of course, are never complete. The “fast track” that we saw in this NFL Combine has likely boosted some rookie speed metrics. If this continues, the formula for future receivers will shift, and these players may project to be even quicker.
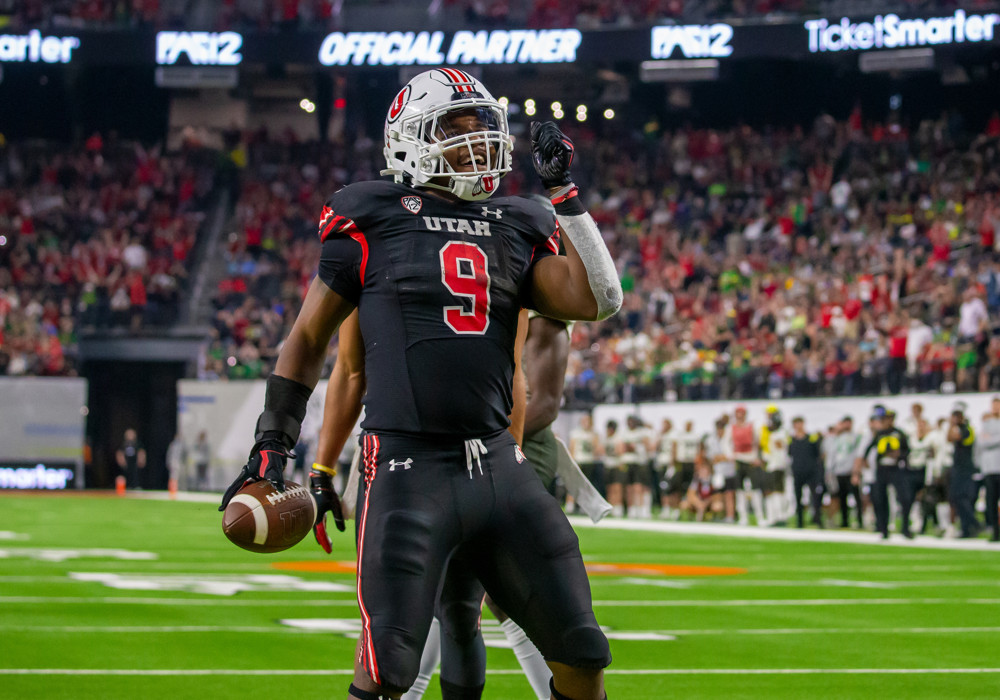
While receivers usually have a slighter build and more long speed, the running back group also offers tons of speed. Rayshon Luke, at only 175 lbs., ran the fastest 100-meter in high school. He very well could project to the NFL as more of a slot receiver. Though this list includes many pure running backs, none may be more physically intimidating than Tavion Thomas. The Utah back who scored 21 TDs last season. Thomas will have competition. Branson Robinson, TreVonte’ Citizen, Jaydon Blue, and Nicholas Singleton as freshmen with potentially elite size-speed combinations.

I look forward to seeing how these predictions play out over the upcoming years and having access to more information than ever, thanks to the sweeping increase of reliance on the internet across the globe. Thank you for reading my article! If you have any follow-up questions, comments, or concerns, don’t hesitate to connect with me on Twitter @DynastyDiagnos1.
Did you hear the big news? The Dynasty Nerds YouTube channel is up and running. Now you can see the podcast straight from the NerdHQ!! Smash that subscribe button. Sign up for the DynastyGM tool to keep that edge over your league mates. Manage all of your dynasty teams, use the trade calculator, and we just added a player shares tool so you can see all players you roster in one place.


